
Static Maps
When you need to visualize what’s happening in your hot or cold aisles, generate a Static Map to quickly evaluate your cooling efficiency.
What is a Static Map?

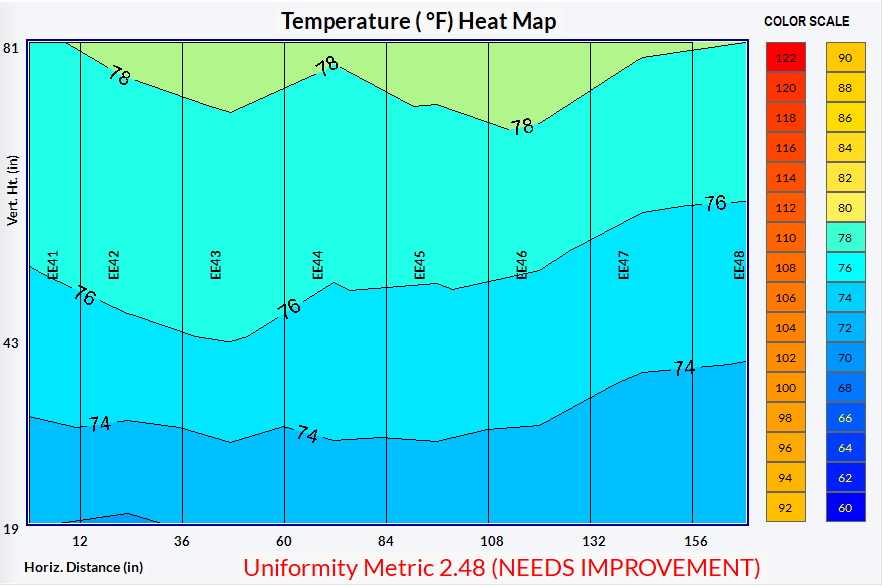
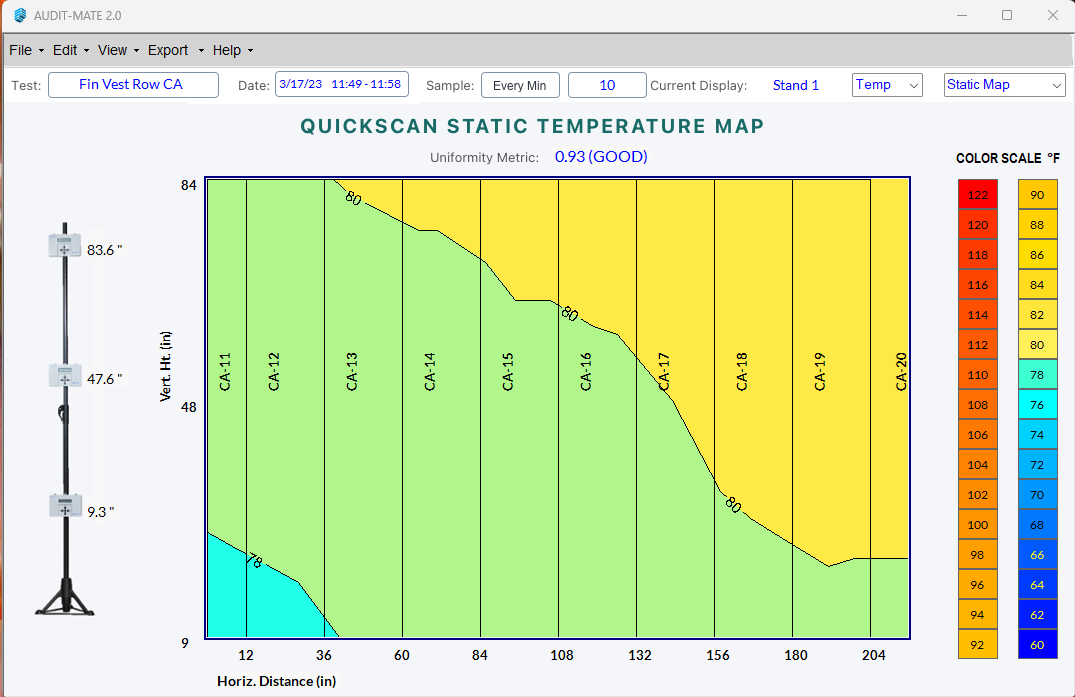
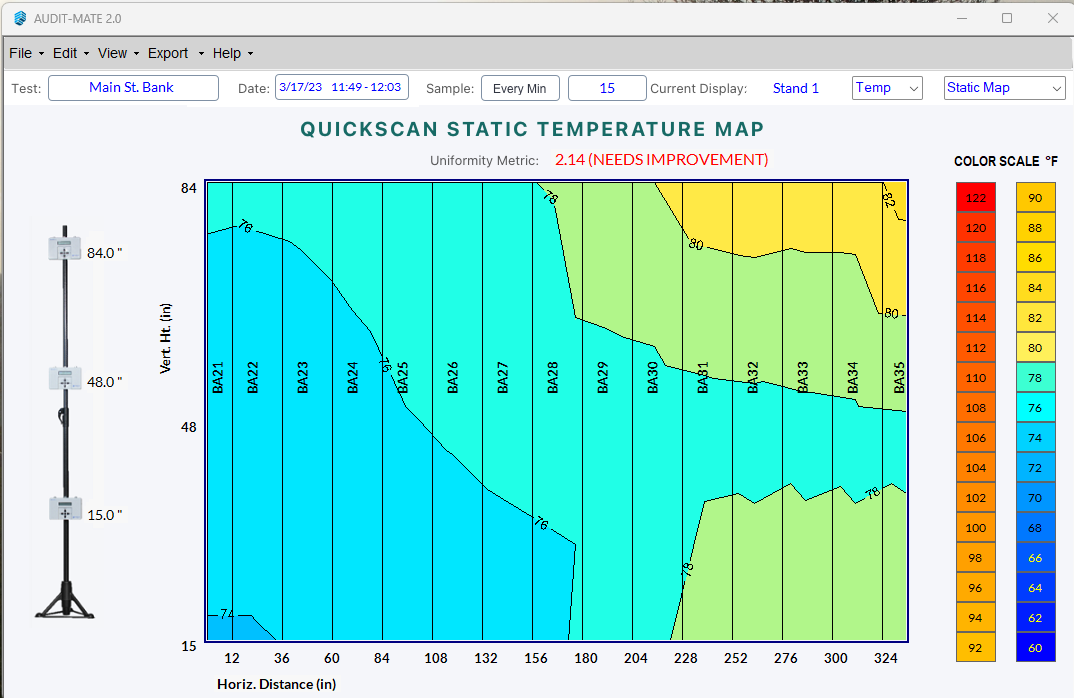
A static map is a visual representation of environmental data collected at three different heights and stitched together to create a comprehensive view of the variations in a given space. Each data point is represented by different colors, allowing for easy identification of areas that may require further attention or adjustment. Each map represents a single moment in time.
What’s Needed to Create a Static Heat Map?
You will need:
At least 1 AUDIT-BUDDY Stand
AUDIT-MATE Software (included with every purchase and rental)
or
Use Purkay Labs’ Thermal Survey Service and we’ll do everything for you.
Contact us to proceed
How Do You Create a Static Heat Map?

Use the AUDIT-BUDDY’s QuickScan mode to take 1 minute scans across multiple locations. Then, use the AUDIT-MATE software to auto-generate the static heat map.
What Types of Static Heat Maps Are There?
You can create a static map from any type of data collected using the AUDIT-BUDDY System‘s QuickScan Mode or Purkay Labs’ Thermal Survey Service.
Static Temperature Map
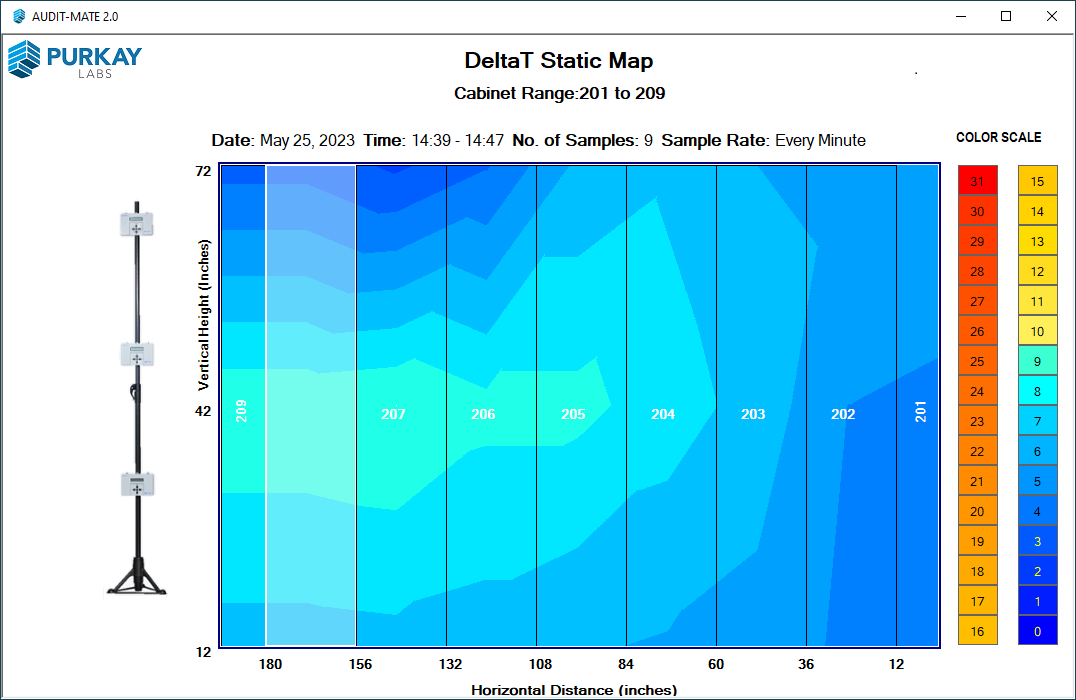
Static Delta-T Map
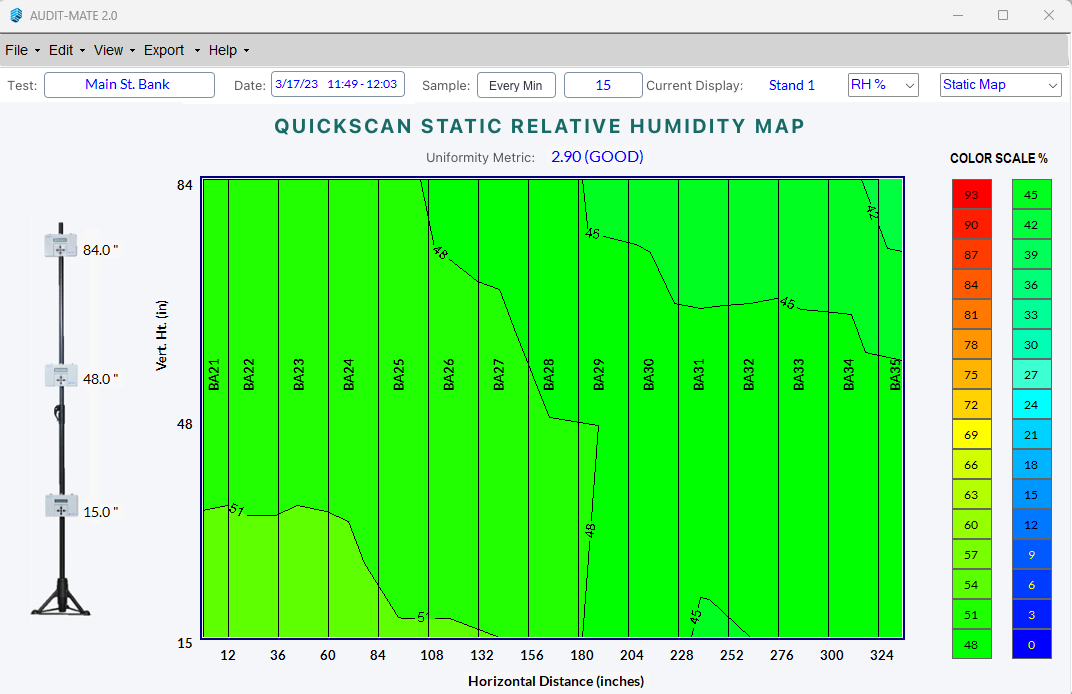
Static Humidity Map
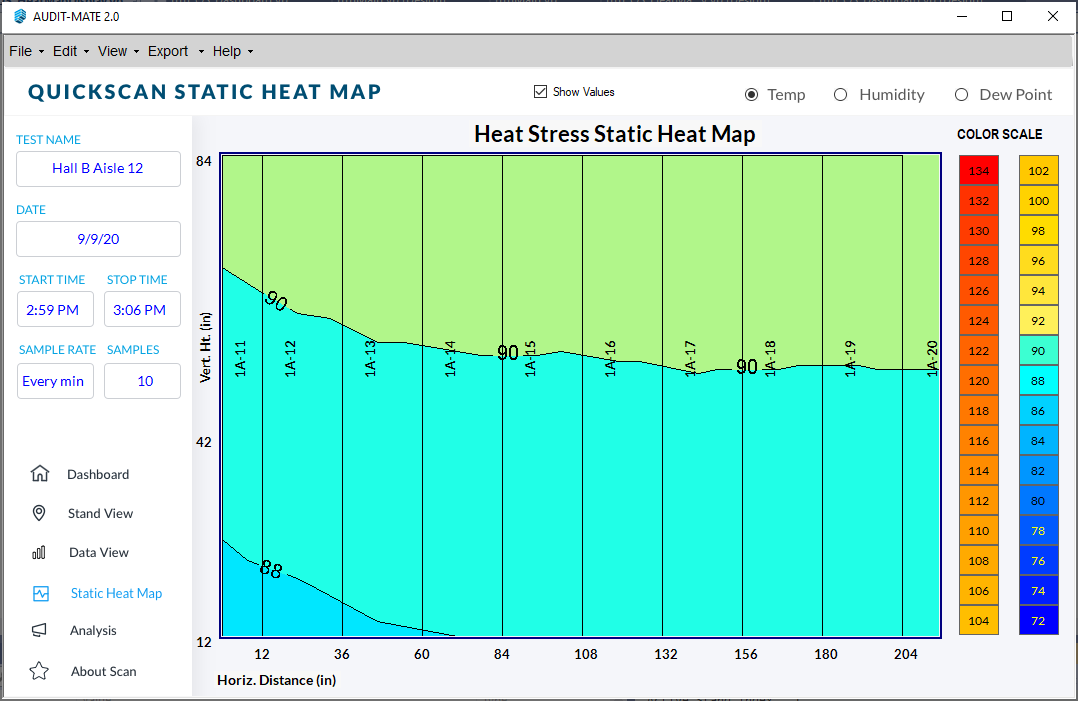
Static Heat Stress Map
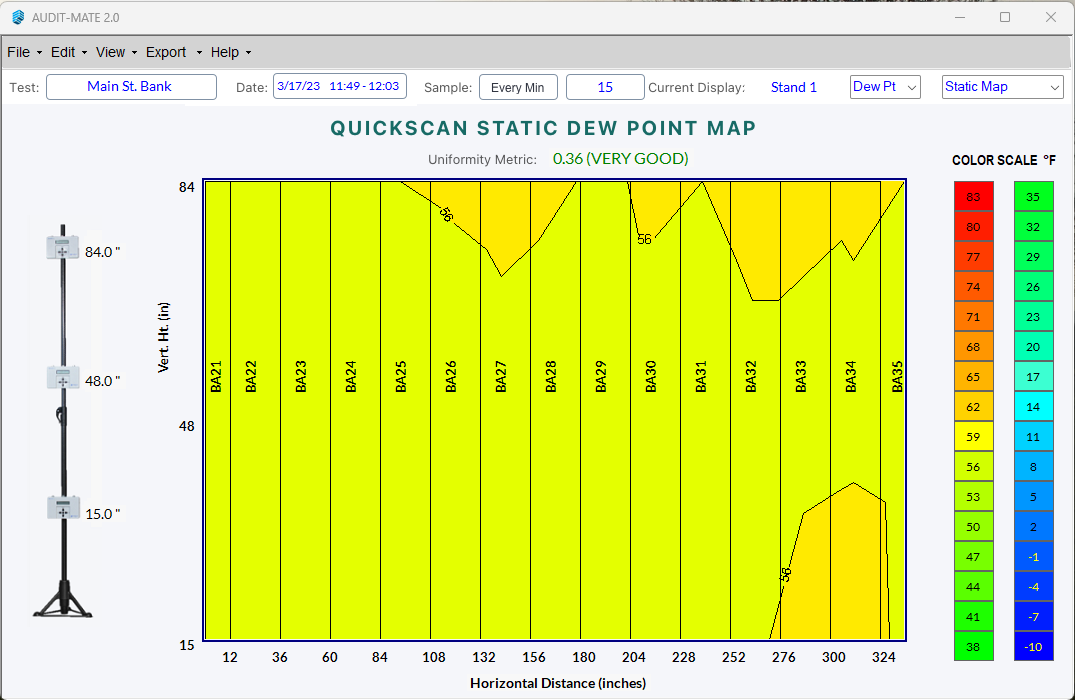
Static Dew Point Map
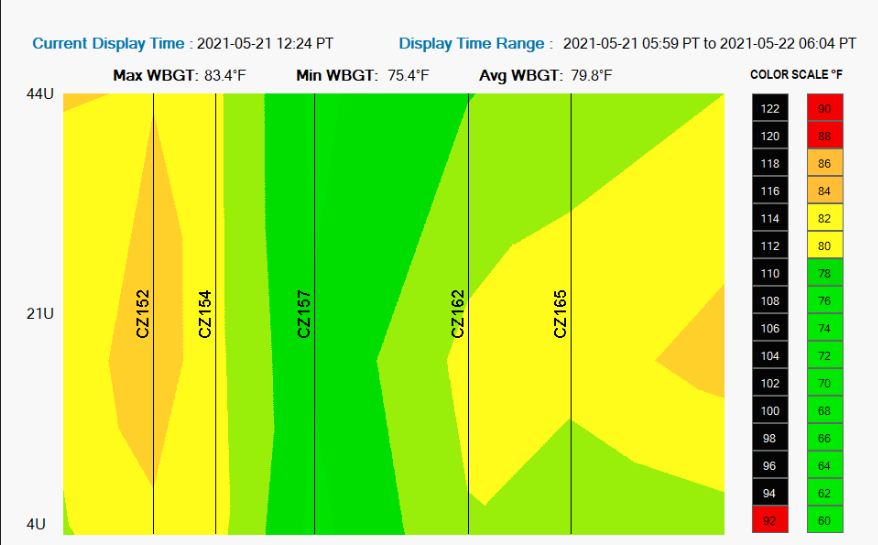
Static WGBT Map
How to Use the Static Heat Map?
We recommend using the static maps to track the variations across your aisle environment. The more variations, the more likely there is a cooling issue to address. We created the Uniformity Metric as a way to benchmark your efficiency.
How to Use Static Maps
Identify Hot Spots
Use the Static Map to quickly identify any potential problems. The included Uniformity Metric quickly shows you if you have a problem to address.
Baseline an Area
Use the Static Map to visualize what’s happening in a specific location. It’s a quick way to identify any potential problems.
Example: Baselining a Data Center Cold Aisle
Example: Baselining a Lab Environment
Create Before and Afters
Quickly create “before" and “after” views of the environment to validate any changes.
Example 1: Removing Perforated Tiles

Average Temperature: 64°F

Temperature Increased by 5-6°F
In this example, the Client wanted to confirm that they could safely increase his inlet temperature by removing the perforated tiles. Before the project began, the client conducted a AUDIT-BUDDY QuickScan to baseline measure the aisle. Then, after the tiles were removed, they ran another QuickScan. As you can see, the temperature increased by 5-6°F.
What are the Benefits of A Static Heat Map?
See the temperature, humidity and/or dew point distribution
Visualize Environment
Get a Quick baseline of an area
Ideal for Before and Afters
Interested in learning more. Contact us to proceed.
If you are interested in trend information, use the same AUDIT-BUDDY stand to generate time-trend graphs.