
What is a Time-Trend Graph?
Use AUDIT-BUDDY™ LongScan data to track environmental changes over time in a single location.
How Do You Create a Time-Trend Graph?
Use the AUDIT-BUDDY system’s built-in LongScan mode to monitor three different heights in a single location. Users determine how long and how often they want to collect data samples.
What Do You Need to Create a Time-Trend Graph?
You will need:
At least 1 AUDIT-BUDDY system
AUDIT-MATE 2.0 software (included with every purchase and rental)
What Types of Time-Trend Graphs Are There?
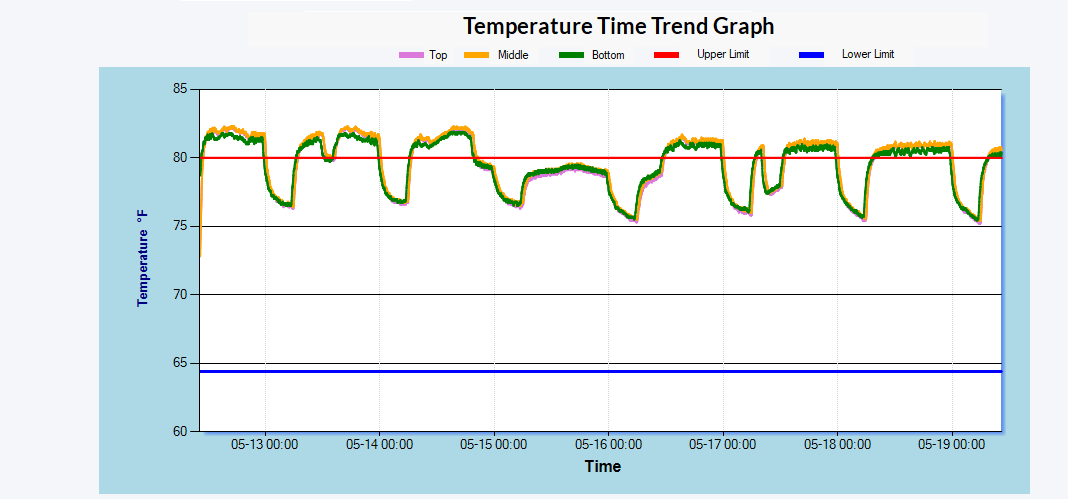
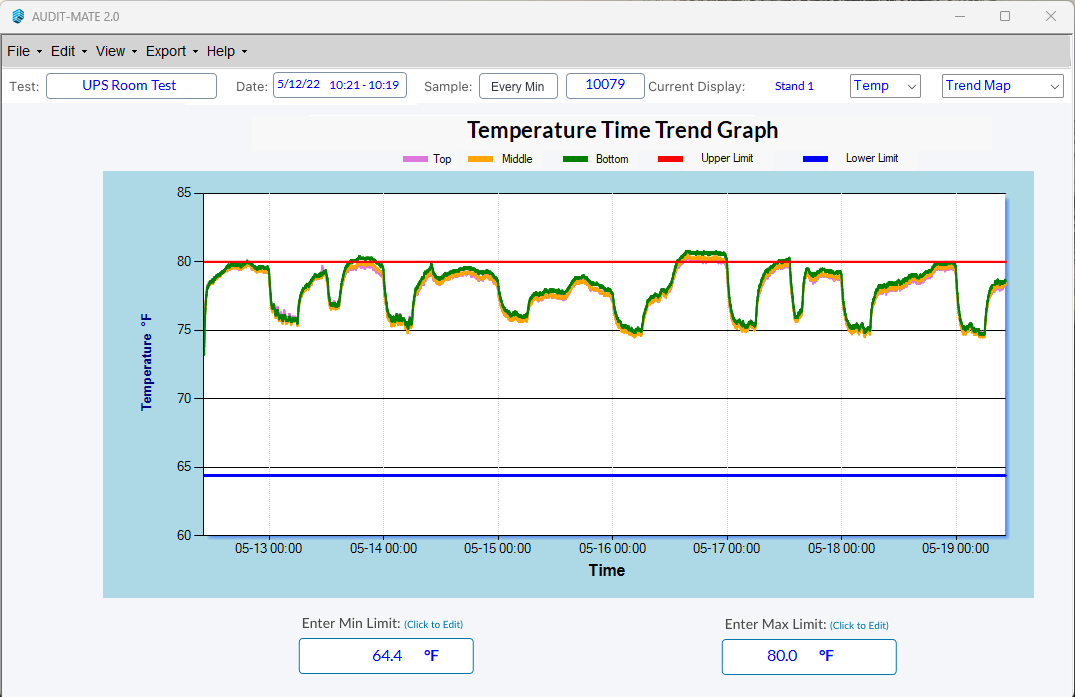
Temperature
Time-Trend Graph

Relative Humidity
Time-Trend Graph
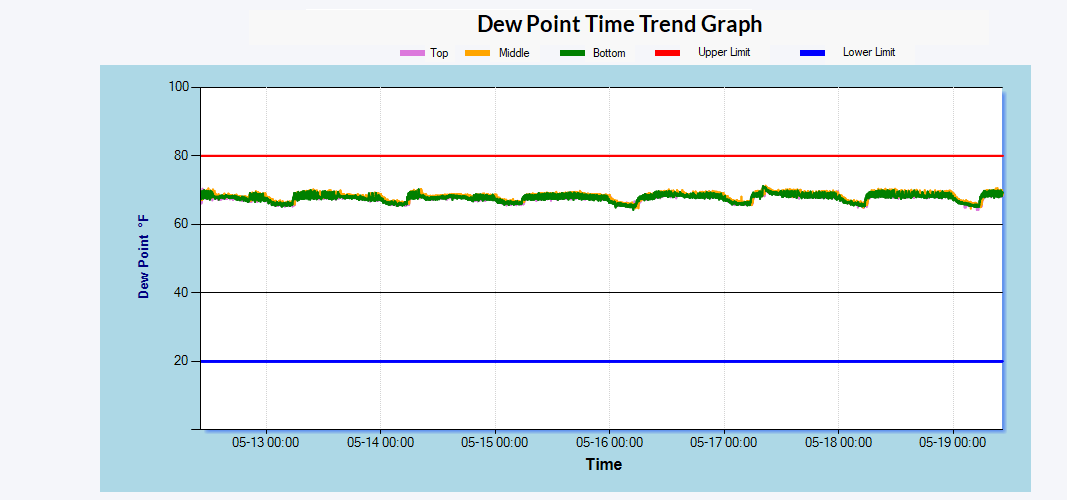
Dew Point
Time-Trend Graph
Features
Set Target Temperature - high or low limits
Update Colors to match your brand
Structured method of monitoring multiple heights and locations simultaneously
Get in-depth look at the environmental performance
Time-Trend Graphs in Action
Time-Trend Graphs are ideal for tracking environmental changes.
Identify Any Major Spikes or Variations
In the example below, a client needed to monitor what was happening in their server closet. They let their AUDIT-BUDDY collect data for 7 days. They found that outside of normal working hours, the temperatures were spiking to well above ASHRAE recommended limits.

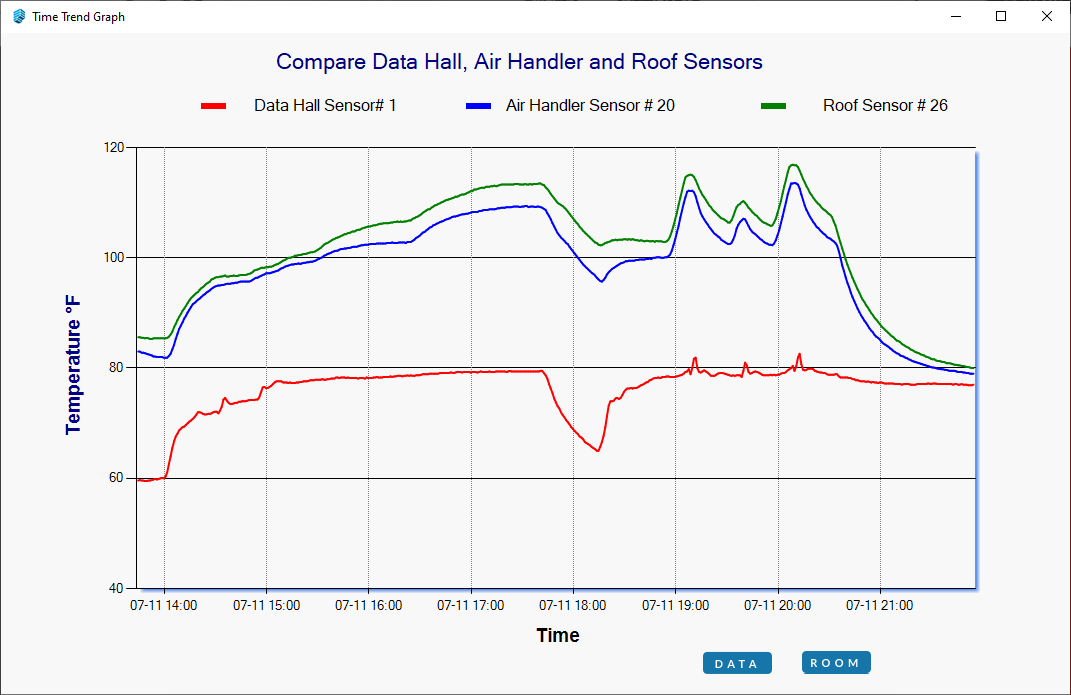
Compare Data from Multiple Locations
In the example below, we used multiple AUDIT-BUDDY stands to collect data across a room during the IST CRAC Stress test. This is a structure and scientific method where measurements are conducted at the same heights across the room. The data is auto-compiled so you don’t have to waste any time on compiling data.

Example: Capturing Room Environment during a CRAC Stress Test
What are the Benefits?
See the change in temp, humidity and/or dew point over time.
Get in-depth look at the environmental performance
Structured method of monitoring multiple heights and locations simultaneously
By using multiple systems in LongScan Mode, you can create Dynamic Maps that offer a thorough analysis of your data center's performance.
Contact us if you are interested in learning more.
Next Steps
The next step is a 30-minute conversation.
No commitment required.
Most teams know something's off. The call is just about figuring out whether we can help — and what that would look like for your facility.
Ready to talk?
Book a free 30-minute pre-assessment call. We'll walk through your facility, your issues, and what an assessment would cover. You'll know by the end of the call whether it makes sense to move forward.
Not sure yet?
Answer 6 questions and get a customized cooling risk report — free, no email required to start.