Deep Dive into the Uniformity Metric
Welcome to Keep Your Cool - simple cooling optimization strategies for busy data center operators.
Last month, we explored the potential issues that can occur after containment is installed. The goal with containment is always to separate the hot and cold airflow patterns from mixing. Despite this, air leaks can occur from missing plates, gaps under of over the server and even because someone left the door open accidentally. We’ve found that periodic measurement of the aisles can lead proactively identify any gaps in your aisle environment - saving money, time, and headaches.
So how do you do this? We recommend taking consistent measurements at the top, middle, and bottom of the same cold aisle as illustrated below.

From there you can utilize the Static Temperature Map in our AUDIT-MATE software that shows—- in varying colors- the different temperature distribution. This is a easily visualization to capture major anomalies - like a hot spot. But what happens if you have varying shades of blue or green? How do you compare this environment to other aisles?
We created the Uniformity Metric as a benchmark to compare multiple aisles or just the same aisle over time. The higher the Uniformity Metric the more likely there are influencers - like missing blanking plates, devices exhausting into the cold aisle, excessive CFM of cold air from a specific perforated tile, air leaking under the cabinet due to gaps created by cabinet feet, which are impacting the even distribution of cold air to the server inlets.
| Uniformity Rating | Range | Description |
|---|---|---|
| VERY GOOD | 0 to 0.49 | Excellent temperature uniformity |
| GOOD | 0.5 to 0.99 | Commendable uniformity with minor variations |
| FAIR | 1.0 to 1.49 | Acceptable uniformity with noticeable variations |
| NEEDS IMPROVEMENT | ⥸1.5 | Significant temperature variations, improvement needed |
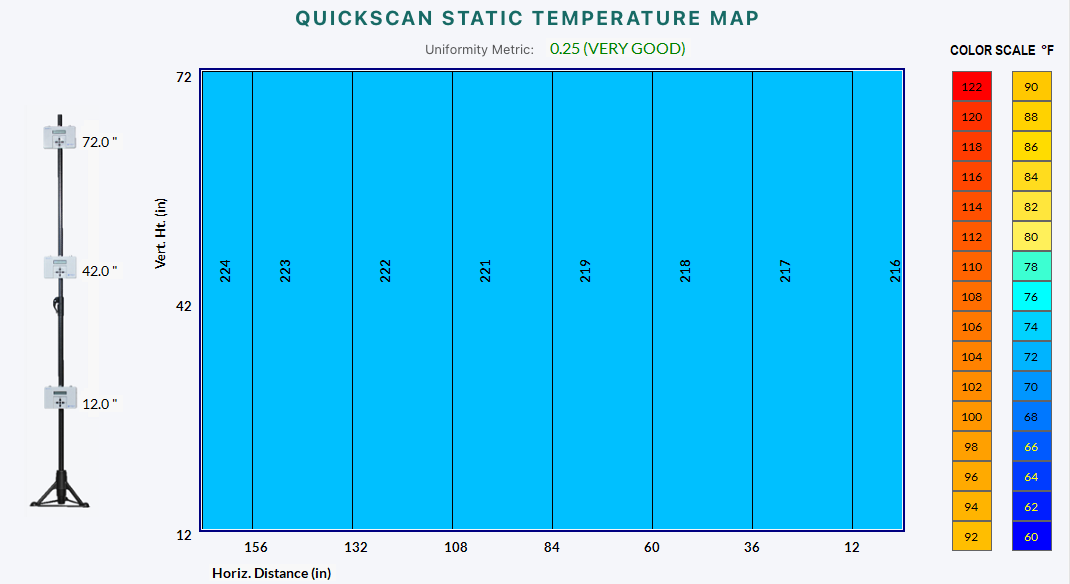
The following example shows a “VERY GOOD” environment, with little to no variation in color/temperature.
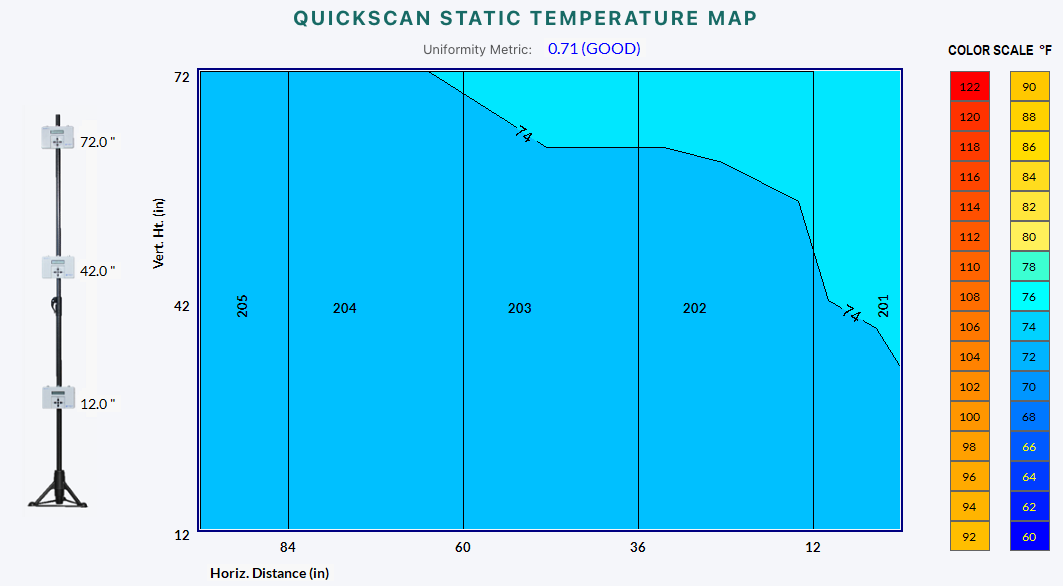
The following example shows a “GOOD” environment has some variation with minor variations.
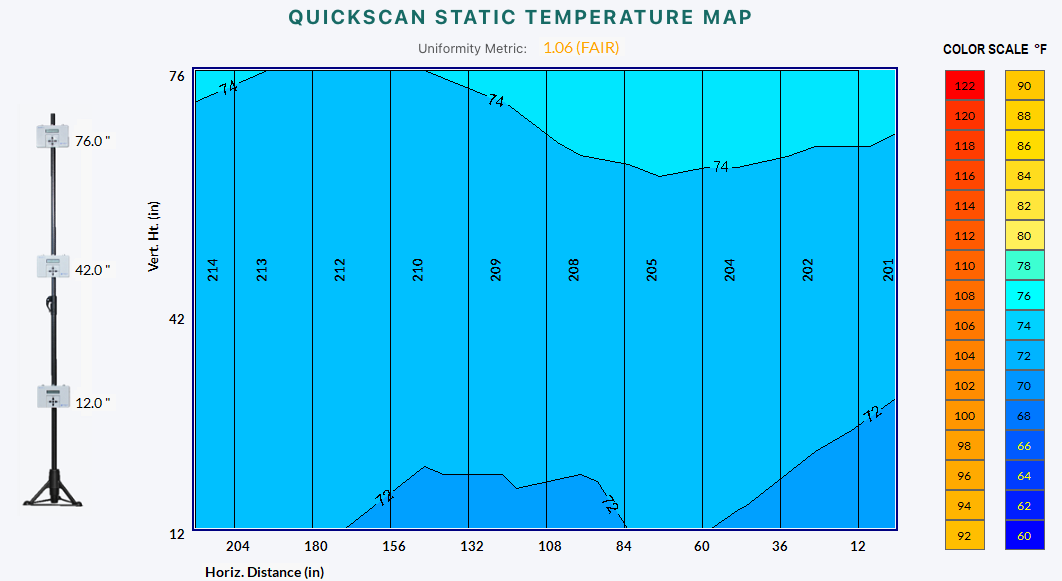
The following example shows a “FAIR” environment, which has noticeable variations.
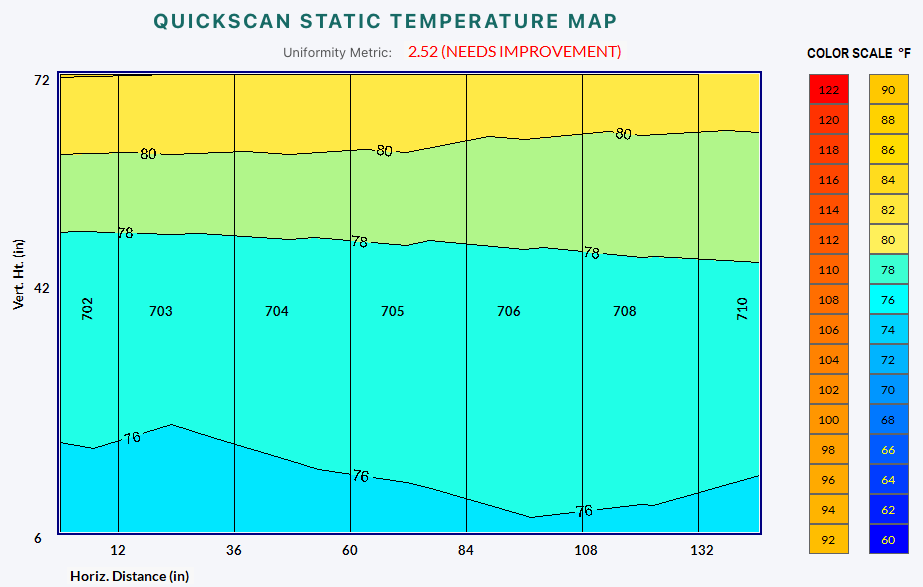
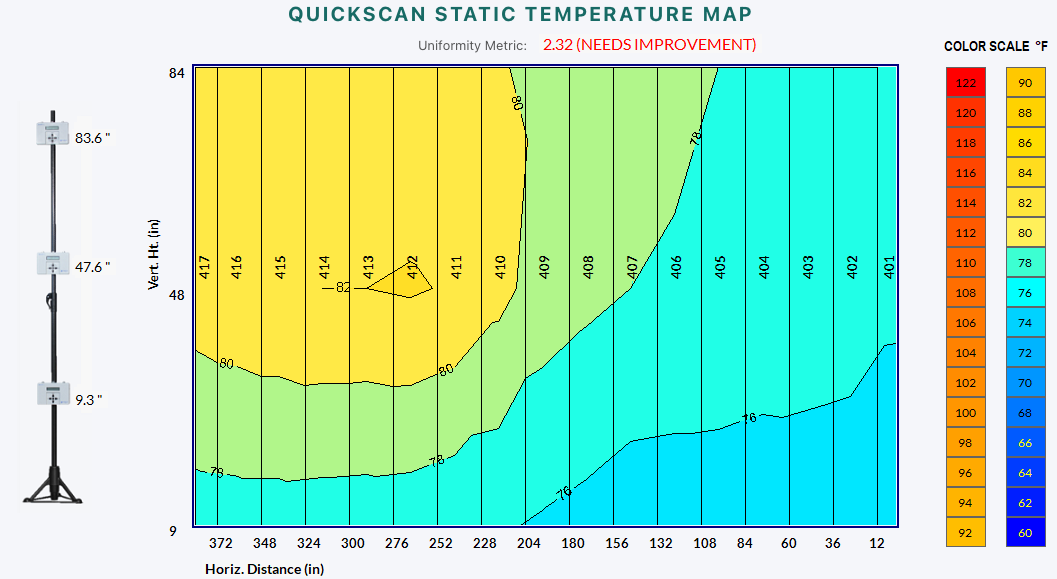
This example shows a “NEED IMPROVEMENT” environment with significant variation. This indicates that you need to take corrective action.
As you can see, regularly auditing your aisles is necessary for managing your environment. Being proactive, let’s you identify potential problems like hot spots or overcooling— anything that may compromise the reliability and performance of your facility.
If you want to learn more about why you need a thermal survey or need someone to come and conduct one for you, please contact us today.
About Purkay Labs
Purkay Labs specializes in thermal surveys for efficient data center management. We offer practical solutions to optimize performance and sustainability. Partner with Purkay Labs for streamlined data center efficiency. You can learn more at www.purkaylabs.com.
Want to Learn More on Uniformity Metric ?
Check out these other Keep your Cool Articles or visit our learning resources page.