Mastering the Heat: Navigating the Hot Aisle Containment
Welcome to Keep Your Cool - our blog dedicated to simplifying cooling optimization for busy data center operators.
This is the last in our series about post-installation containment. So far we’ve done a general overview on post-installation containment, how to evaluate (with data), and done a deep dive into the cold aisle containment. Today we’ll be focusing in on the hot aisle containment - what it is, how to manage it post-installation and what to look out for.
What is Hot Aisle Containment?
Hot aisle containment is way of separating the hot and cold air streams in the data center. The most common design directs hot exhaust air from servers into the enclosed aisle, either through overhead ducts or raised floors (see Figure 1 below). This methodology efficiently isolates the hot air, preventing its mixing with the cold supply air and optimizing cooling processes.
Figure 1: Hot Aisle Containment Design
The best way to evaluate your hot aisle containment is by conducting periodic audits of the aisles. Despite being contained, there can still be gaps, leaks or improper installation. By auditing your hot aisles, you can quickly identify —visually and with data — what’s happening and is it good or not.
When we, at Purkay Labs, conduct an audit, we collected measurements at every cabinet at three different heights to capture the stratification. We use our static heat map software to create an image of what’s happening in the space. This is an easy way to quickly visually evaluate the hot aisle. With the static heat map, we provide a uniformity rating between 0 and above 1.5 to give you a scale of how well the aisle is performing. The lower the rating, the better you are doing. You can see the metric below:
| Uniformity Rating | Range | Description |
|---|---|---|
| VERY GOOD | 0 to 0.49 | Excellent temperature uniformity |
| GOOD | 0.5 to 0.99 | Commendable uniformity with minor variations |
| FAIR | 1.0 to 1.49 | Acceptable uniformity with noticeable variations |
| NEEDS IMPROVEMENT | ⥸1.5 | Significant temperature variations, improvement needed |
Real Life Application - 2 Customer Hot Aisle Contained Aisles
Take the following examples for two different customer sites. Both spaces have contained hot aisles, however there is a significant temperature variation between the two maps. In Figure 3, the temperature color is very consistent — only two shades of yellow (80-82. The uniformity metric for this aisle is 1.41, which shows that this aisle is FAIR. In contrast, Figure 4 has a lot of variation — four different shades, and a uniformity metric of 2.44 which NEEDs improvement. Utilizing both the visual aid of the Static Heat Map and the numerical assessment are easy ways to determine your cooling effectiveness.
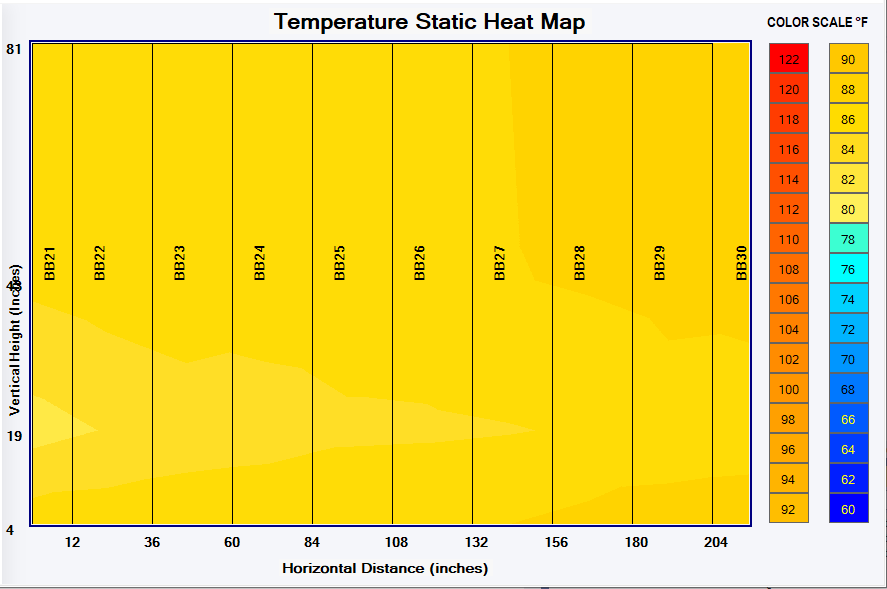
Figure 3: Contained Aisle with Uniformity Metric: 1.41
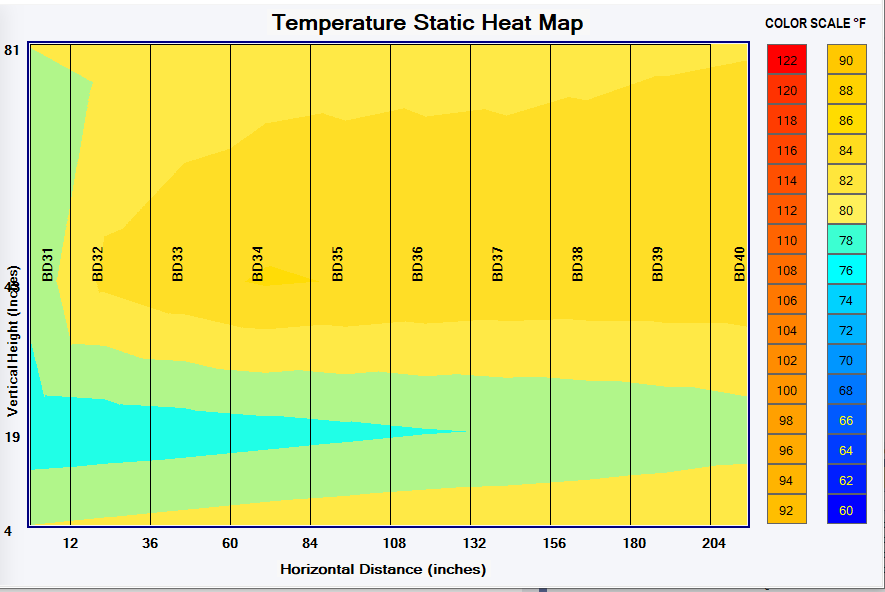
Figure 4: Contained Hot Aisle with Uniformity Metric: 2.44
One thing to note: achieving low variance in a hot aisle is not the sole goal. Even if an aisle appears uniform, meeting desired temperature values is crucial. An example underscores this point: despite a seemingly uniform aisle with a measured average temperature within acceptable limits, deviations may impact the overall efficiency.
The benefits of a Thermal Survey by Purkay Labs for Hot Aisle contained systems become evident. The survey not only identifies variance in the hot aisle but also assesses whether the containment system aligns with the target temperature.
Common issues to look for in hot aisle containment include improper duct sealing, gaps in containment structures, inadequate management of return air, variations in server exhaust temperatures, and the impact of changes in server configurations. Addressing these issues proactively ensures the sustained efficiency of hot aisle containment systems in data centers.
Want to Learn More on Containment and its impact on efficiency ?
Check out these other Keep your Cool Articles or visit our learning resources page.


