Case Study: Fixing Hot Spots During COVID-19
Overview
During the height of the COVID-19 pandemic, a Fortune 50 Online Retailer faced challenges due to increased server loads and reduced on-site staffing. Critical hot spots threatened server uptime despite the Building Management System (BMS) indicating normal temperatures. The retailer employed Purkay Labs' AUDIT-BUDDY™ systems to perform a detailed thermal survey, which successfully identified and resolved these discrepancies within 24 hours.
The Project
In April 2020, amidst the pandemic, the retailer had to significantly ramp up server capacity to handle increased online traffic, while simultaneously scaling back on-site staffing and preventative maintenance. The retailer's data center in Dallas, TX, featured a 20,000 ft² raised floor with 350 cabinets and faced cooling challenges as it approached its capacity limits. When the BMS registered alarm readings from a dense area of the data center without adequate sensor coverage to pinpoint issues, the retailer turned to Purkay Labs' AUDIT-BUDDY™ for an independent verification of the environment.
The Systems Engineer used AUDIT-BUDDY™ in two key ways:
QuickScan Mode: Quick 20-second scans were taken at each cabinet in the area where the BMS alarms were triggered. This generated a Static Temperature Map highlighting the environment across the aisle, particularly identifying Cabinet 202 as significantly warmer than its surroundings.
Delta-T Scan Mode: To diagnose the root cause of the hot spot, a detailed delta-T scan was conducted measure the change in temperature across the cabinet. Sensors were placed at the front and back of Cabinet 202 at heights of 6”, 36”, and 72” to measure temperature changes across the cabinet for a 24-hour period.
The Results
Example Air Performance Screen - Before
Example Air Performance Screen - After
Disclaimer: To protect Client Confidentiality, Purkay Labs has altered the data.
The initial QuickScan revealed that Cabinet 202 was notably warmer due to a fully opened perforated tile placed directly in front of it. The cooling systems were already operating at maximum capacity, making additional cooling infeasible. The Delta-T scan mode provided further insights into the airflow dynamics, showing 50% bypass airflow and 40% recirculation at the top of Cabinet 202. Using these findings, the Systems Engineer implemented a temporary curtain to separate the hot and cold aisles, which was later validated by the AUDIT-BUDDY™'s Air Performance Calculator as having significantly reduced both bypass and recirculation airflow.
Six hours after implementing the curtain, the Air Performance calculator indicated improved conditions, with more cold air effectively cooling the cabinets rather than being wasted. The before and after behavior illustrated by the AUDIT-BUDDY™ screens confirmed the efficacy of the implemented solution.
Conclusion
Faced with the dual challenges of increased operational demand and reduced on-site presence due to COVID-19, the retailer effectively utilized AUDIT-BUDDY™ to quickly identify and resolve critical hot spots that threatened server uptime. This case study demonstrates the importance of having reliable on-site diagnostic tools like AUDIT-BUDDY™ that can quickly adapt to emergency situations, providing essential data that enables informed decision-making and swift corrective actions.
About Purkay Labs
Purkay Labs is committed to providing data center operators with simple, standalone, and cost-effective portable environmental monitoring systems. Our flagship product, AUDIT-BUDDY™, offers quick, reliable, and independent assessments of data center environments, helping manage airflow, reduce Scope II emissions, and optimize cooling efficiency.
About the Thermal Survey Service
Purkay Labs' Thermal Survey Service provides a comprehensive evaluation of data center environments, employing advanced tools like AUDIT-BUDDY™ to capture precise temperature, humidity, dew point, and delta-T measurements across multiple facility locations. This service is designed to support data center operators in their efforts to optimize infrastructure and ensure efficient operation without disrupting daily activities.
How does the Air Performance / Delta-T Calculator Work?
You can read more here:
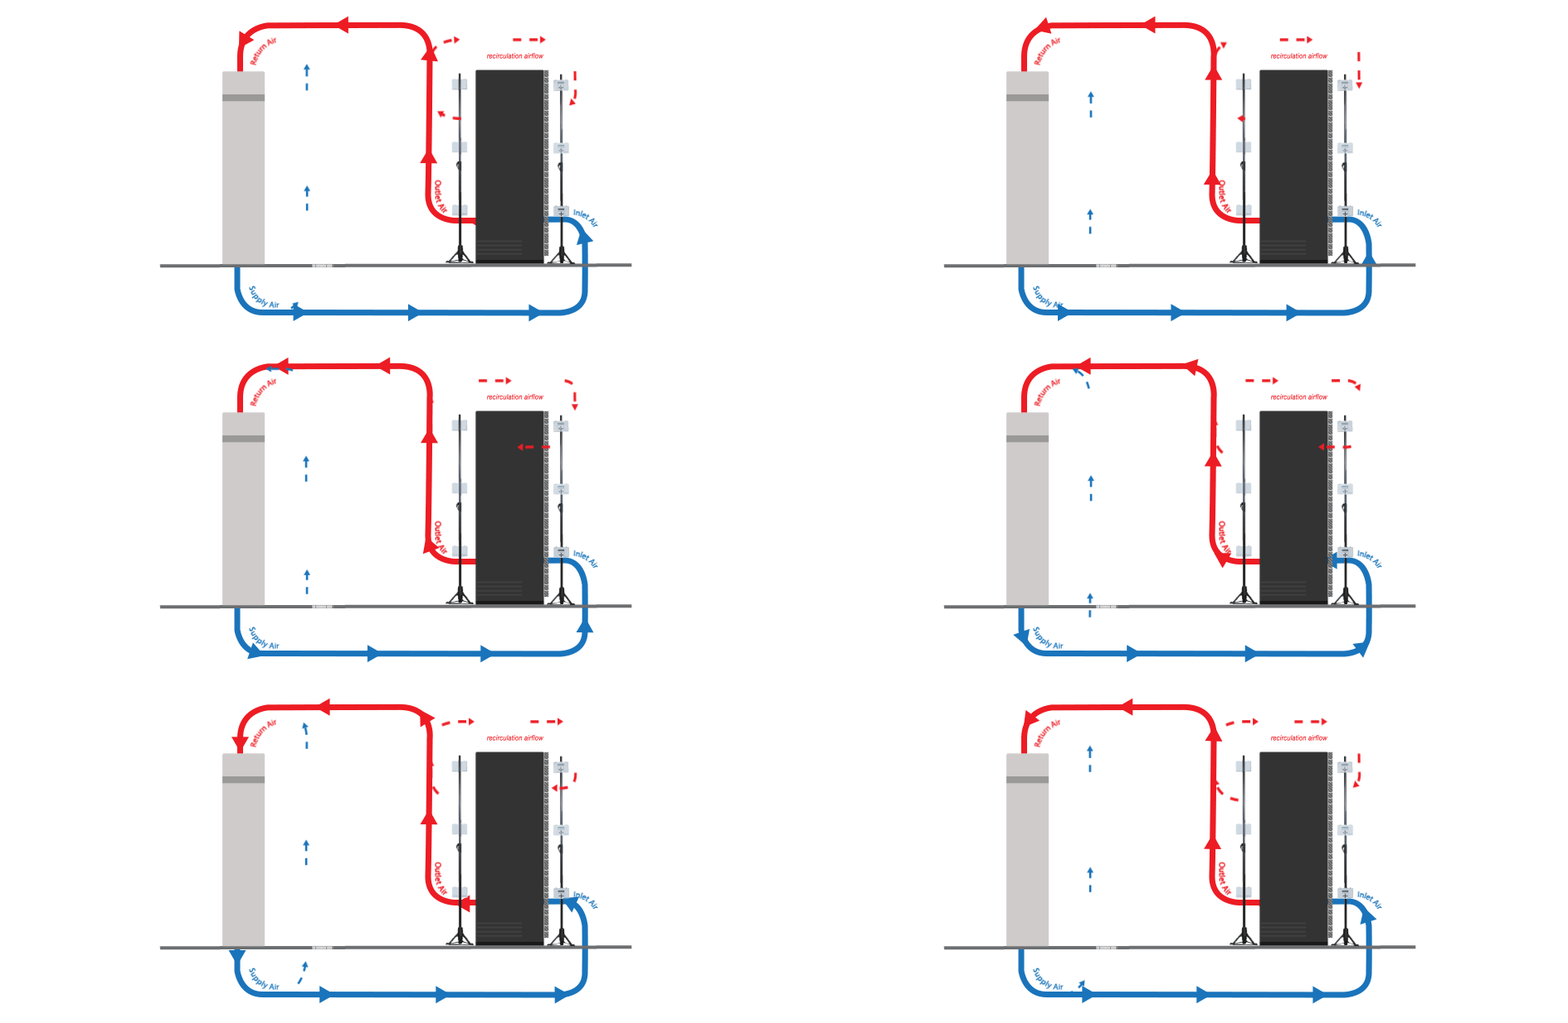
Figure 3: Ideal Airflow
Figure 4: Realistic Airflow
In an ideal (raised floor) scenario, there would be a closed loop cooling pattern, where all CRAC supplied cold air goes to the cabinet, and all exhaust air goes back to the CRAC unit (See Figure 3: Ideal Airflow). In reality, some air escapes through gaps in the floor (bypass airflow) or returns to server inlet (recirculation airflow), resulting in hot spots or overcooled areas(See Figure 4: Realistic Airflow).
By looking at four temperature values - CRAC supply, Server Inlet, Server Exhaust, CRAC return — you can diagnose the effectiveness of your cold air.
Some Rules of Thumb
The closer the CRAC ΔT and the Cabinet ΔT are to each other, the more air is flowing correctly.
If your CRAC Return is cooler than your server exhaust, you may have bypass airflow
if your server inlet temp is warmer than the CRAC supply, you may have recirculation airflow
Purkay Labs automates these airflow calculations within WIFI-MATE Air Performance Calculator.


