Precision in Every Pixel: Introducing the Uniformity Evaluation Metric
Welcome back to Keep Your Cool - our series dedicated to simplifying cooling optimization for busy data center operators. Last week, we talked about potential issues that can occur after containment is installed. This week, we are expanding on how to determine if you have a problem, using our Uniformity Metric.
Understanding the Uniformity Metric: A Straightforward Assessment Tool
The Uniformity Metric is a simple way to gauge cooling efficiency in your aisle. When you set up a data center, cold air is directed from CRAC or CRAH units to the server inlet. This air cools servers, and the resulting warm exhaust returns to the cooling unit. The aim is consistency or uniformity, ensuring the cold air maintains a consistent temperature as it reaches the server inlet.

Figure 1: Data Center Cooling Pattern
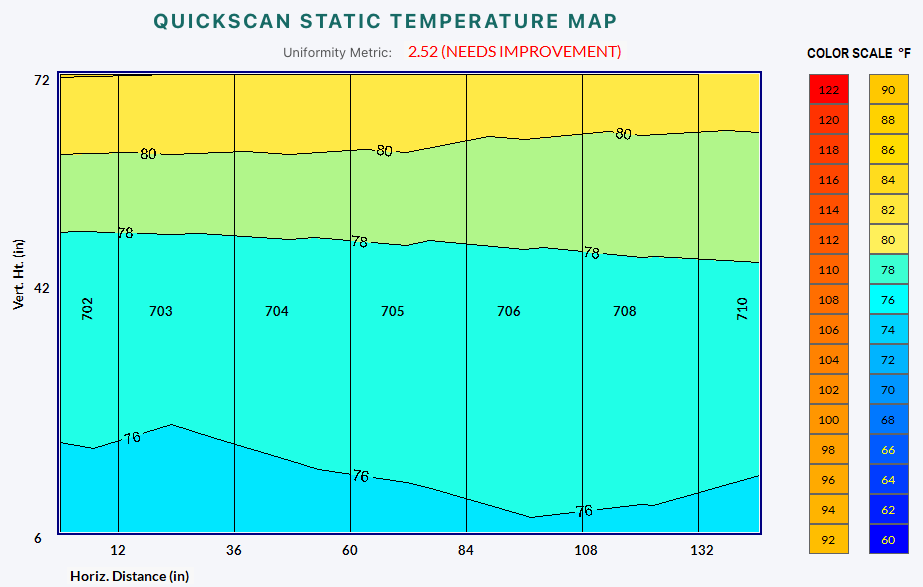
If the air going to the server remains consistent, the temperature distribution across the aisle stays uniform, like in Figure 2. However, if the air changes from one height or rack to another, the temperature distribution becomes uneven, like in Figure 3.

Figure 2: Even Temperature Distribution
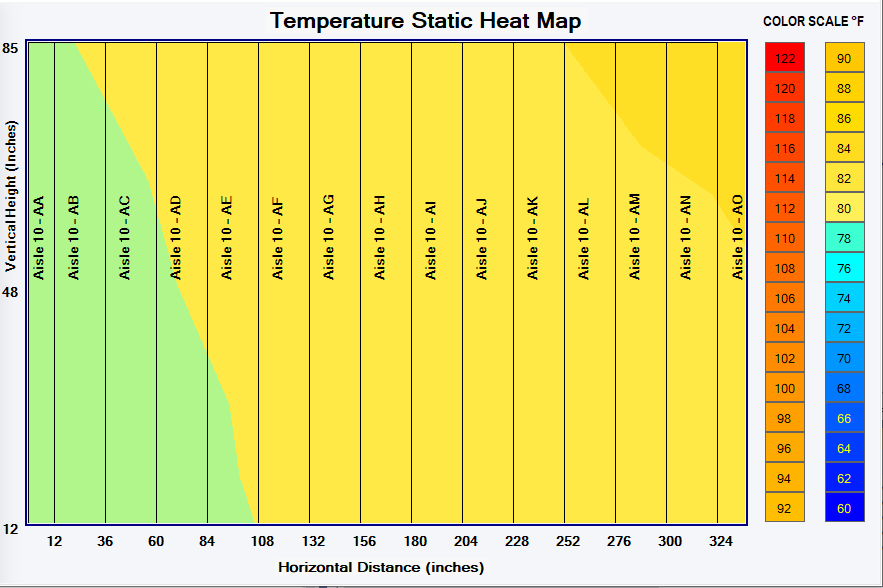
Figure 3: Uneven Temperature Distribution
While creating a static temperature map is an initial step in assessing your environment, determining the tolerable degree of variation can be challenging. This is where the uniformity metric comes into play.
How it Works: Data Collection & Analysis
Everything begins with data collection. Following ASHRAE TC9.9 committee recommendations, we suggest gathering data at three different heights for every cabinet across the aisle. By calculating the standard deviation of these measurements, you can assess temperature consistency. Lower numbers indicate more uniform temperatures across the entire vertical plane. We've simplified the assessment by assigning values to different numbers.
| Uniformity Rating | Range | Description |
|---|---|---|
| VERY GOOD | 0 to 0.49 | Excellent temperature uniformity |
| GOOD | 0.5 to 0.99 | Commendable uniformity with minor variations |
| FAIR | 1.0 to 1.49 | Acceptable uniformity with noticeable variations |
| NEEDS IMPROVEMENT | ⥸1.5 | Significant temperature variations, improvement needed |
The Practical Role of the Uniformity Metric: Effectiveness and Issue Identification
The key takeaway is to use the Uniformity Metric to to evaluate how uniformly temperature (or humidity or dew point) is distributed across your aisles. With this metric, you can:
Assess the effectiveness of your temperature control strategies.
Identify potential issues like leaks, gaps, or holes.
Get a baseline of your current environment (to compare later)
Numbers based, not imagination based.
The higher the Uniformity Metric the more likely there are influencers - like missing blanking plates, devices exhausting into the cold aisle, excessive CFM of cold air from a specific perforated tile, air leaking under the cabinet due to gaps created by cabinet feet, which are impacting the even distribution of cold air to the server inlets. About Purkay Labs
Purkay Labs specializes in thermal surveys for efficient data center management. We offer practical solutions to optimize performance and sustainability. Partner with Purkay Labs for streamlined data center efficiency. You can learn more at www.purkaylabs.com.
Want to Learn More on Uniformity Metric ?
Check out these other Keep your Cool Articles or visit our learning resources page.