
Baseline Your Facility for Optimal Cooling Performance
Energy efficiency is a top concern for every data center operator, yet many overlook or underestimate the vital first step—establishing a baseline of the current environment. Only by understanding where you stand can you chart a course for improvement and unlock the full potential of your facility.
The Project:
In late 2022, Purkay Labs was approached by a customer with a specific requirement: to conduct a baseline assessment in their facility in preparation for a radical change in their cooling strategy. The objective of the project was to gather vital information that would serve as a reference point before the changes were made. The principle driver for the customer was to improve the overall PUE and reduce their carbon footprint.
The Assessment
Our dedicated team at Purkay Labs embarked on an extensive audit of the customer's facility, employing our advanced AUDIT-BUDDY system for accurate and reliable data collection. The process involved benchmarking temperature, humidity, dew point, and server delta-T at every powered cabinet throughout the data center.

Data Hall Viewer Program
Non-Intrusive Data Collection:
One crucial aspect of the audit was our commitment to conducting measurements without any disruption to the daily operations. We ensured that our assessment team adhered to best practices, taking care not to touch server cabinets or impede the facility's workflow.
The Results
At the end of the project, Purkay Labs delivered the following:
Raw Data
Static Maps for Every Aisle
Interactive Viewer Program with Data
Summary Report with Key Findings
The Assessment revealed that there were locations with presence of low cabinet delta-T and significant variations across the data center aisles. This was contributing to a high PUE because a fair amount of cooling was unnecessary. In addition, one aisle was showing the presence of hot spots because of insufficient cooling.
Result 1: Understanding Low Cabinet Delta-T and Its Significance
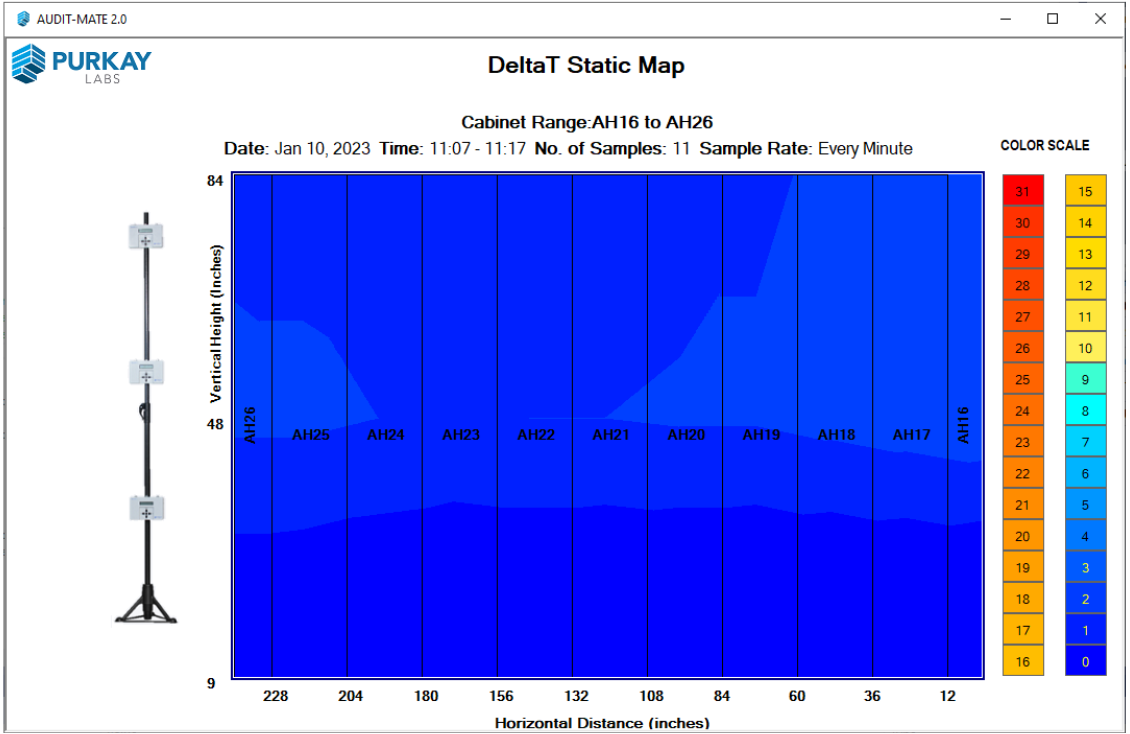
Example of a Delta-T Static Map
Cabinet delta-T is a crucial metric that measures the temperature difference between the intake and exhaust air of servers. As part of our thorough audit process, we conducted simultaneous temperature measurements at the front and back of servers, allowing us to accurately calculate the average cabinet delta-T. This valuable data enables us to pinpoint areas that require attention and take steps to optimize cooling efficiency.
Low cabinet delta-T values indicate that more cold air is being used to cool the IT equipment than is actually required. This presents a significant opportunity for improving overall efficiency through the implementation of straightforward airflow management strategies. By addressing low cabinet delta-T, organizations can achieve better cooling performance while reducing energy consumption.
Result 2: Temperature Variation Across Aisles
The Assessment data also revealed temperature variations across the data center aisles, indicating air recirculation or leakage. Several different conditions were noted. Purkay Labs Static Maps is an excellent way to visualize the temperature variations in the cold aisle as shown in the following examples. The temperature variation immediately indicates how efficient or inefficient the cooling system at the site is. Three different aisles observations were noted:
Hot Spots - Certain temperatures were exceeding ASHRAE limit of 80.4°F as indicated by the following static Temperature Map.
Properly Cooled Aisle with very little variation
Low Cabinet Delta-T, where the value across the entire aisle is 3.0°F or below. This indicates a very inefficient cooling system for this aisle with a lot of cold air being wasted.

Static Temperature Map - Aisle with Significant Temp Variations

Static Temperature Map Example- Properly Cooled Aisle
In this facility, the contained spaces showed a more even, consistent temperature distribution across the aisle profile, highlighting the benefits of containment systems in improving airflow efficiency. The example above shows the difference.
Data is the Key
This case study illustrates the benefit of using the collected data to identify aisles with significant temperature variations. Collecting the data for all the aisle, by defining variation thresholds, businesses can focus on areas that require attention and implement targeted improvements to optimize cooling and airflow management.
Conclusion:
Establishing a baseline for benchmarking progress is an essential step in the pursuit of energy efficiency in data centers. It provides a starting point, allows for identification of improvement opportunities, tracks progress, and aids in informed decision-making. By recognizing the importance of a baseline assessment and leveraging the data it provides, you can drive significant improvements in energy efficiency, reduce operational costs, and contribute to a more sustainable and environmentally friendly data center ecosystem.
This case study demonstrates the invaluable insights gained through Purkay Labs' comprehensive On-Site Assessment using the AUDIT-BUDDY system. By leveraging accurate and detailed data, businesses can identify areas for improvement, enhance efficiency, and achieve optimal performance in their data centers.
About Purkay Labs
We believe that Data Center Operators deserve quick, reliable and independent data about their white space environment, without the burden of complicated permanent monitoring systems. We create simple, standalone, and cost-effective portable environmental monitoring systems so you can get data wherever and whenever you need it. Our flagship product- the AUDIT-BUDDY system- is the first multi-height portable environmental monitor that provides data to help manage your airflow, reduce Scope II emissions, increase energy efficiency & cooling optimization.
You can follow us @purkaylabs or visit our website: www.purkaylabs.com
About the On-Site Assessment Service
With Purkay Labs On-Site Assessment Service, our expert team will travel to your facility and conduct an extensive audit of your facility’s layout and environment. Purkay Labs will provide comprehensive and accurate temperature, humidity, dew point and serve delta-T data at multiple locations across the facility. Using the AUDIT-BUDDY system, Purkay Labs will capture data at three heights, and will not touch any cabinets or impact the daily operation. Purkay Labs will work with your team to get the data you need based on the project specifications.